Imagine you’re an HTML DOM Visualizer, what would you see ?
Aharef give us an answer coding one in Processing, based on Traer Physics.
Now, let’s see the look and feel of this blog, www.dereckson.be www.double-v.com and Espace Win 🙂
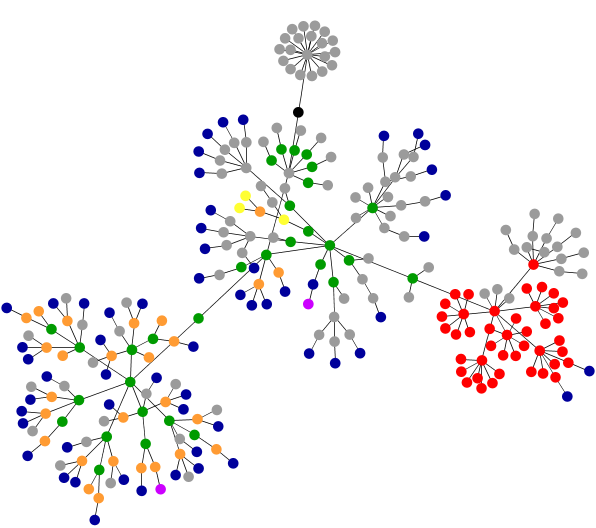
This blog :
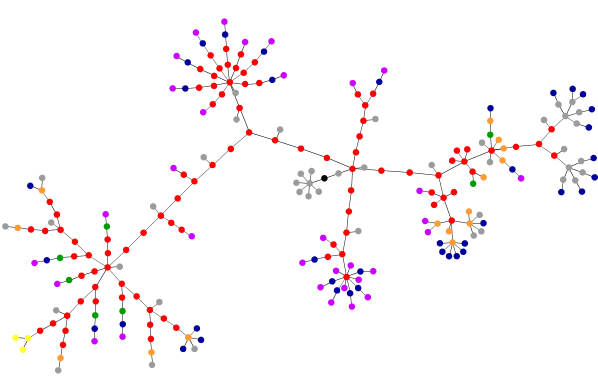
Espace Win
The graphs are posted in the topic “À quoi ressemble notre forum ?” of our board in Life @ Espace Win.
Légende :
- blue: for links (the A tag)
- red: for tables (TABLE, TR and TD tags)
- green: for the DIV tag
- violet: for images (the IMG tag)
- yellow: for forms (FORM, INPUT, TEXTAREA, SELECT and OPTION tags)
- orange: for linebreaks and blockquotes (BR, P, and BLOCKQUOTE tags)
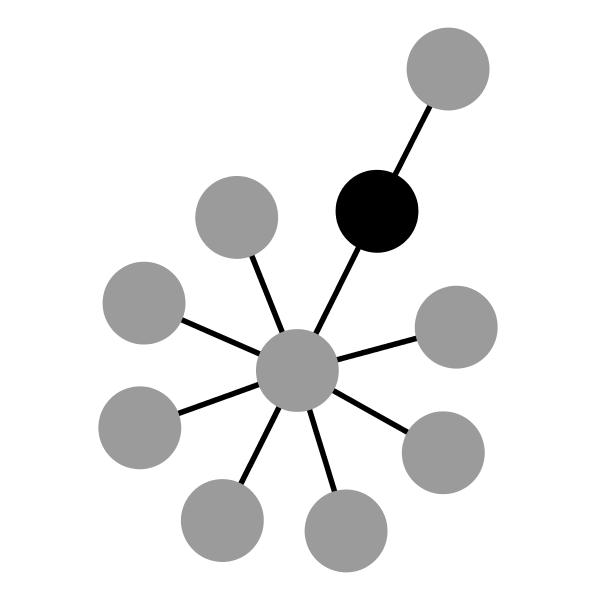
- black: the HTML tag, the root node
- gray: all other tags
Source code :